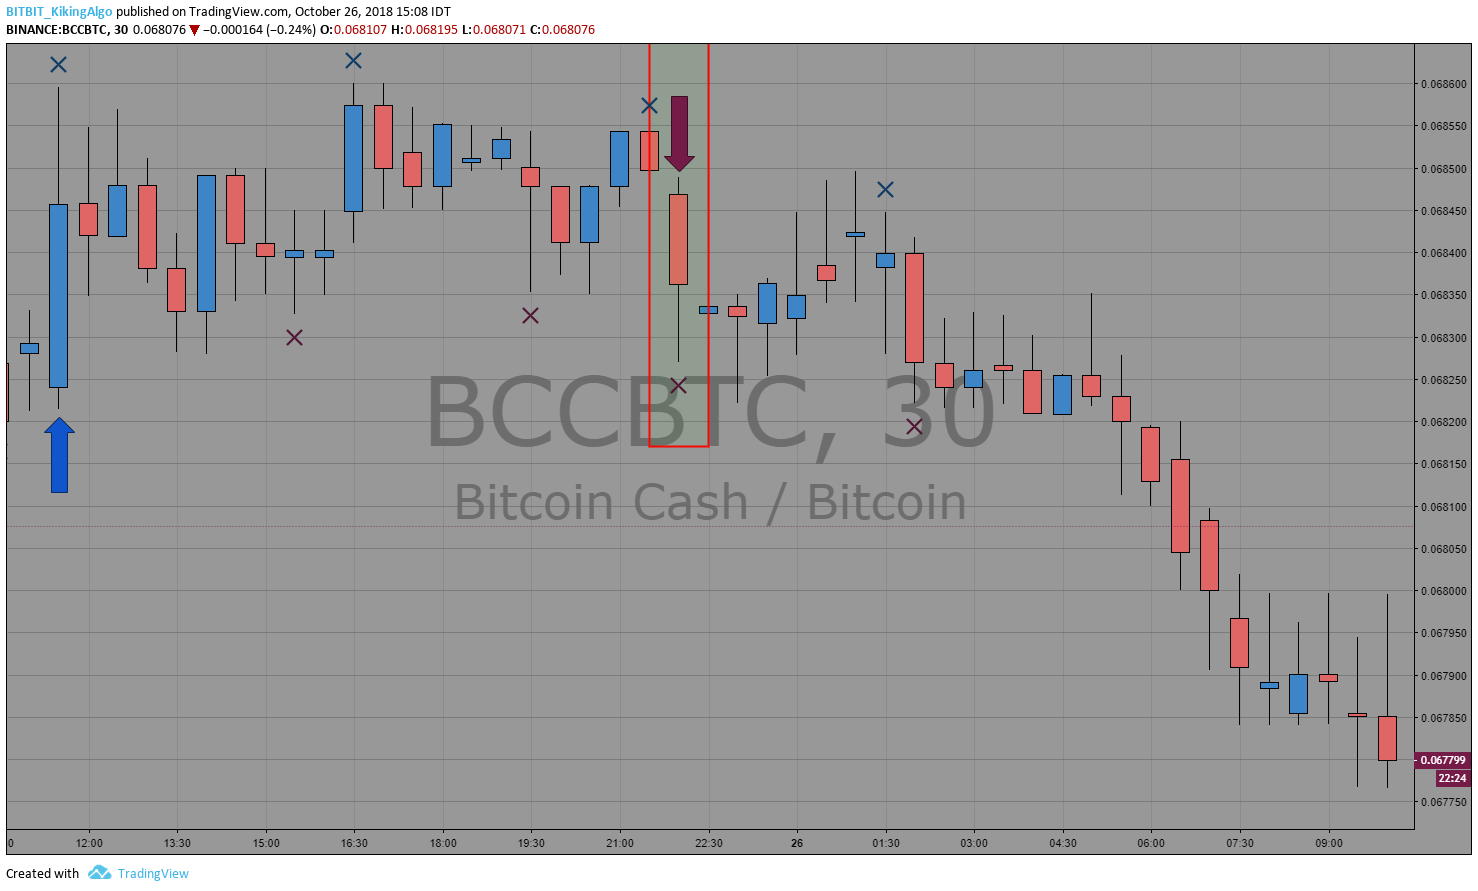
NOTE: the explanation is valid to all charts and time frames, no metter if you are trading with NINA-LONGterm /NINA-SHORTterm or other.
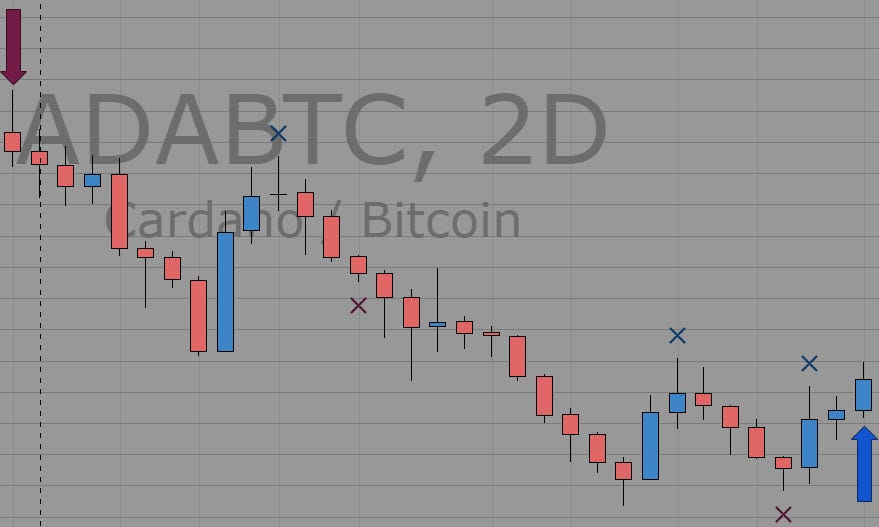
RED ARROW: NINA PRINT SHORT / SEll CALL
GREEN ARROW: NINA PRINT LONG/ BUY CALL
RED X: NINA PRINT POSSIBLE SUPPORT CHECK
GREEN X: NINA PRINT POSSIBLE RESISTANCE CHECK
We added some After Call ScreenShots for a better explanation.
On every layout, the longest time frame is the “Caller”
Make sure it’s not a “live candle”, we need it close or wait for atleast 3/4 of the current movement to end.
As much as the arrows are close to the call, highst chanse you will grab the longest movement.
Scenario A | LONG CALL
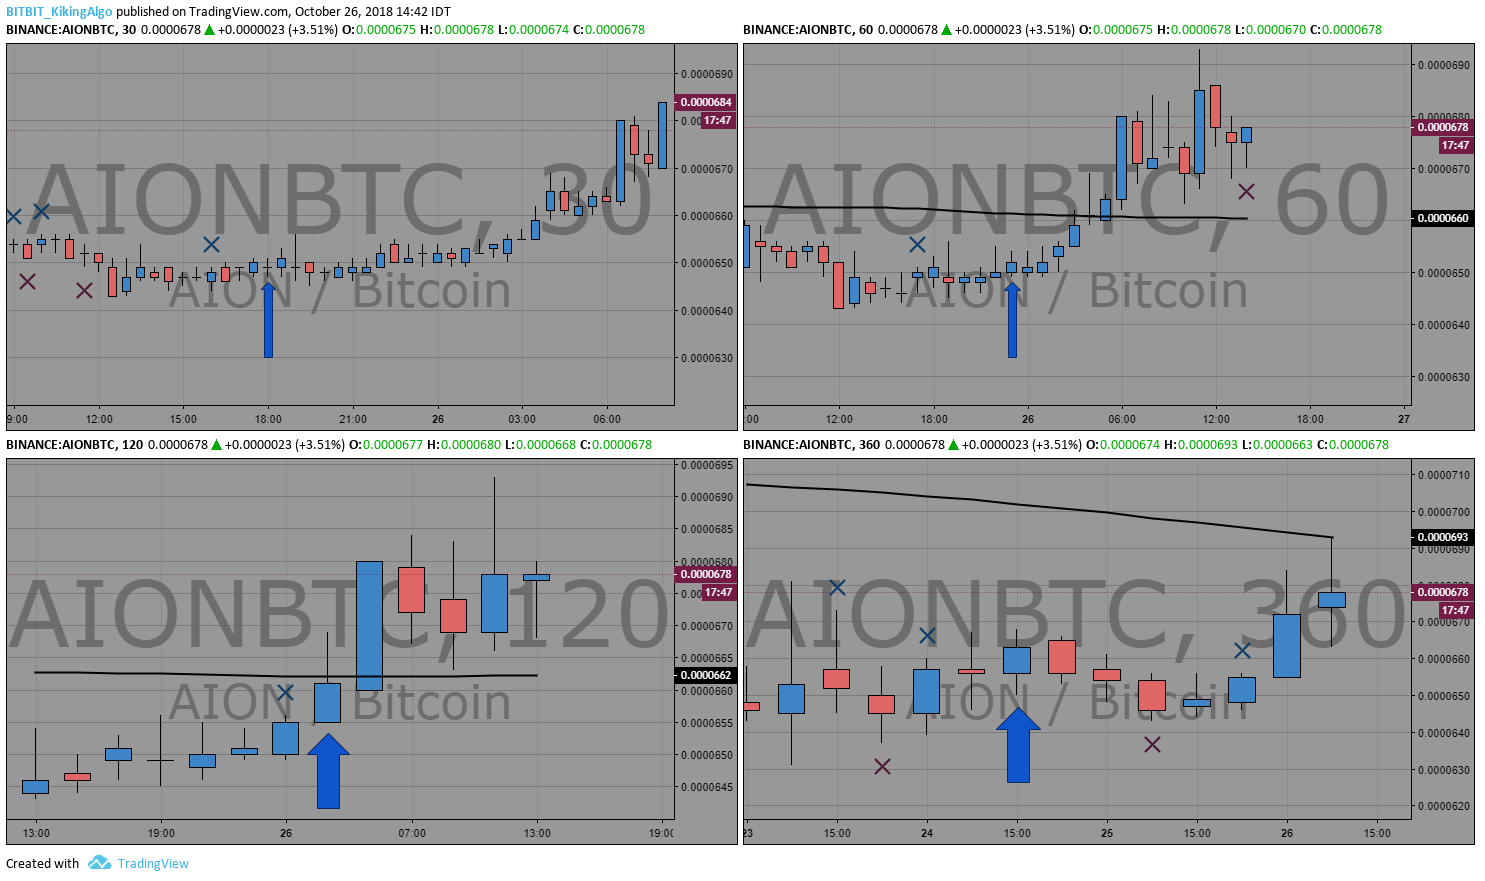
In the next example, we see 360 min print long.
We check all others TF(timeframe) to get confirmation on long.
Scenario B | SHORT CALL
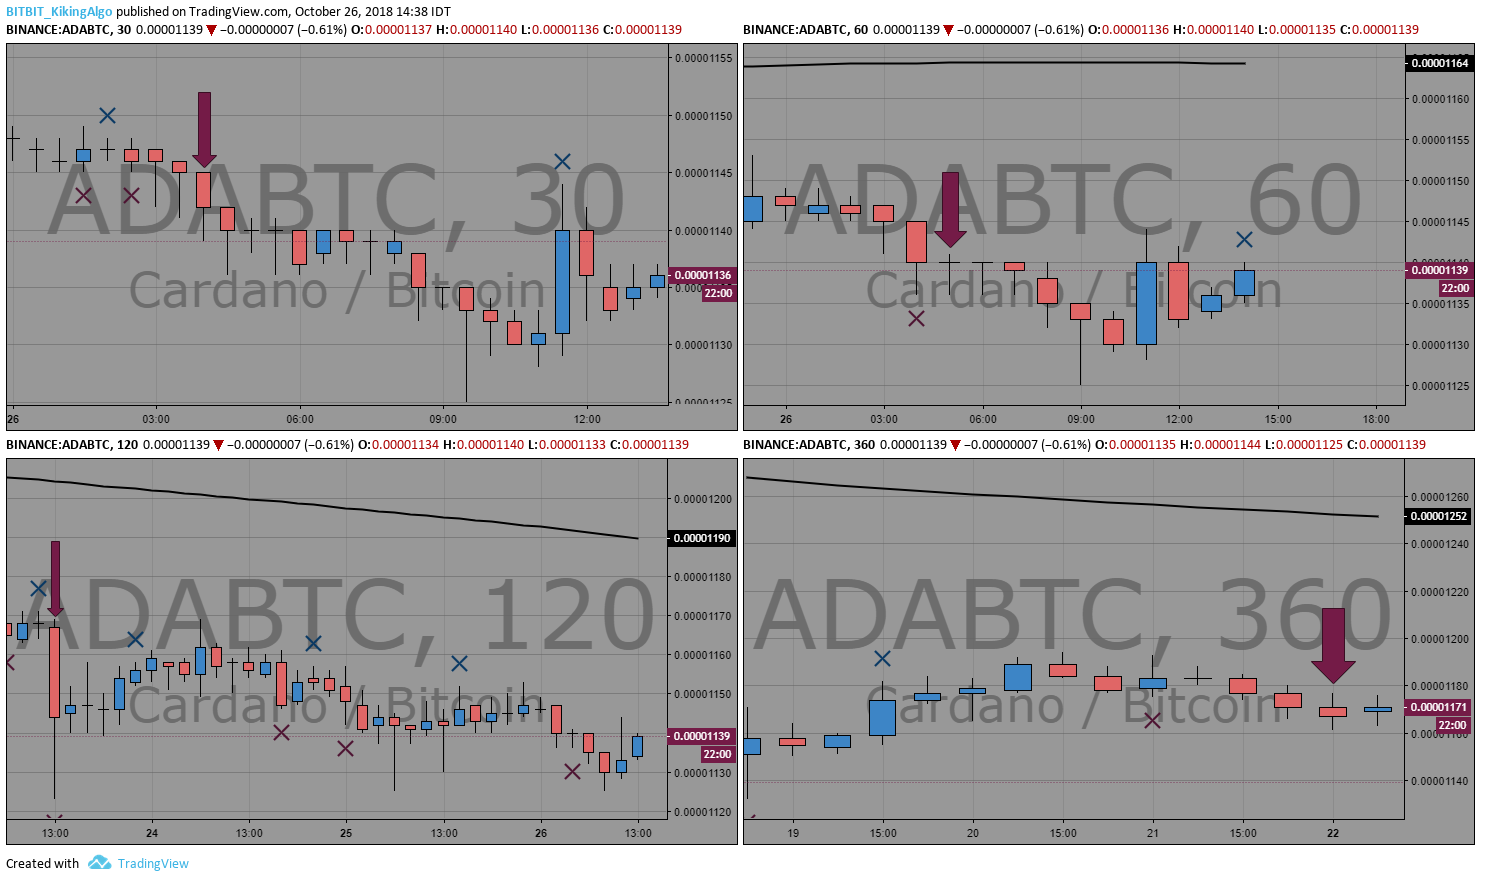
In the next example, we see 360 min print short.
We check all others TF(timeframe) to get confirmation on short.
In the next example, we see 360 min print red x after a long call.
We check all others TF(timeframe) to follow the signs.
We expect to discover some change of trend on others TF.
Now we need to take action, move stop loss to entrance point, lock profit or be ready to close the position.
RED X, meaning: The trend is now checking the support! And support might not hold.
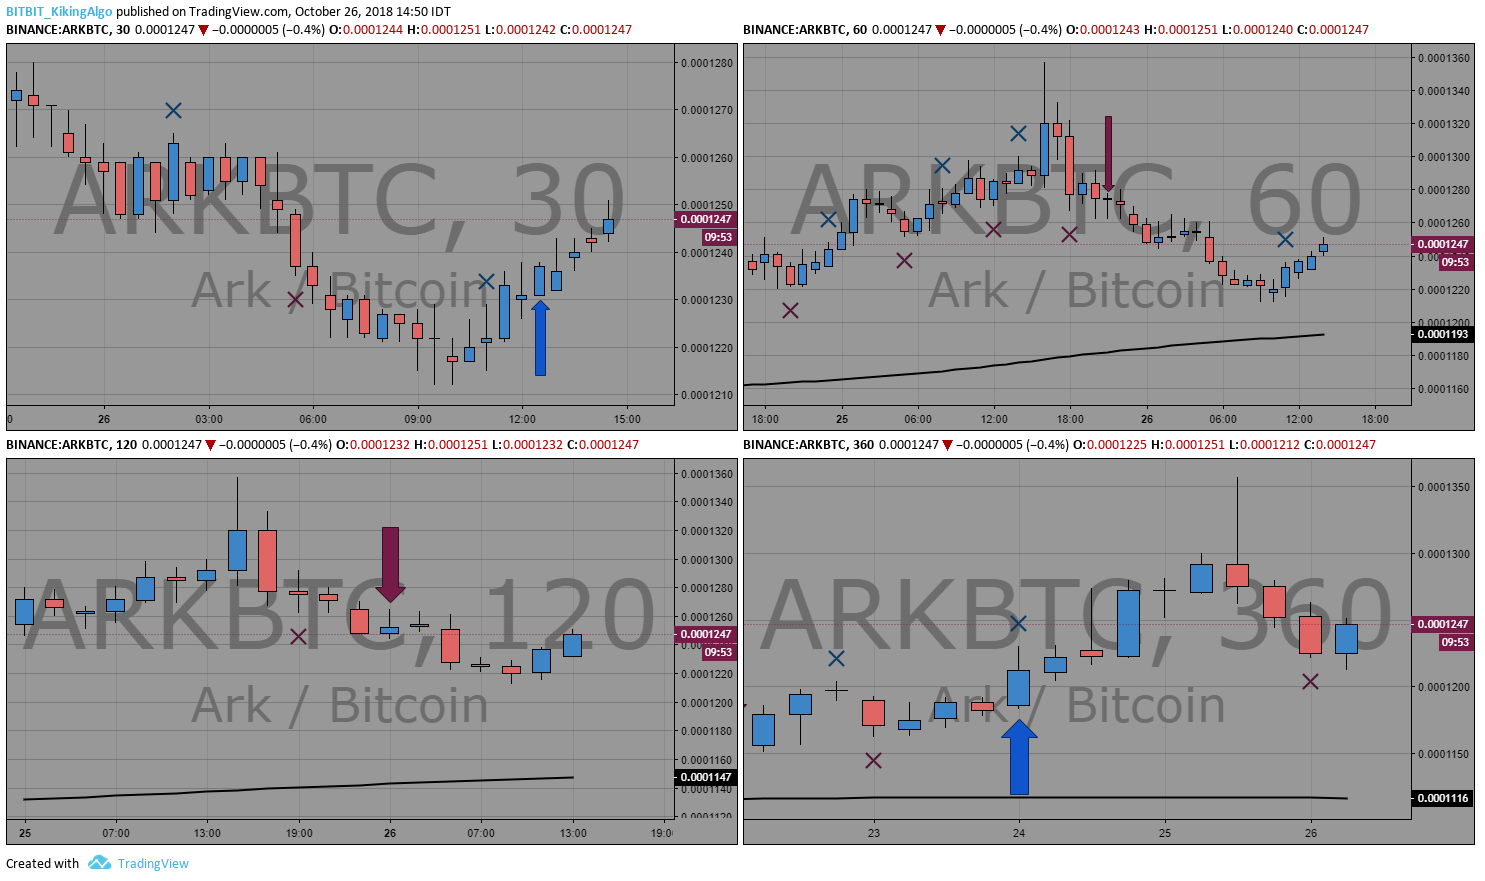
In the next example, we see 360 min print green x after a short call.
We check all others TF(timeframe) to follow the signs.
We expect to discover some change of trend on others TF.
Now we need to take action, move stop loss to entrance point, lock profit or be ready to close the position.
Green X, meaning: The trend is now checking the resistance! And resistance might brack.
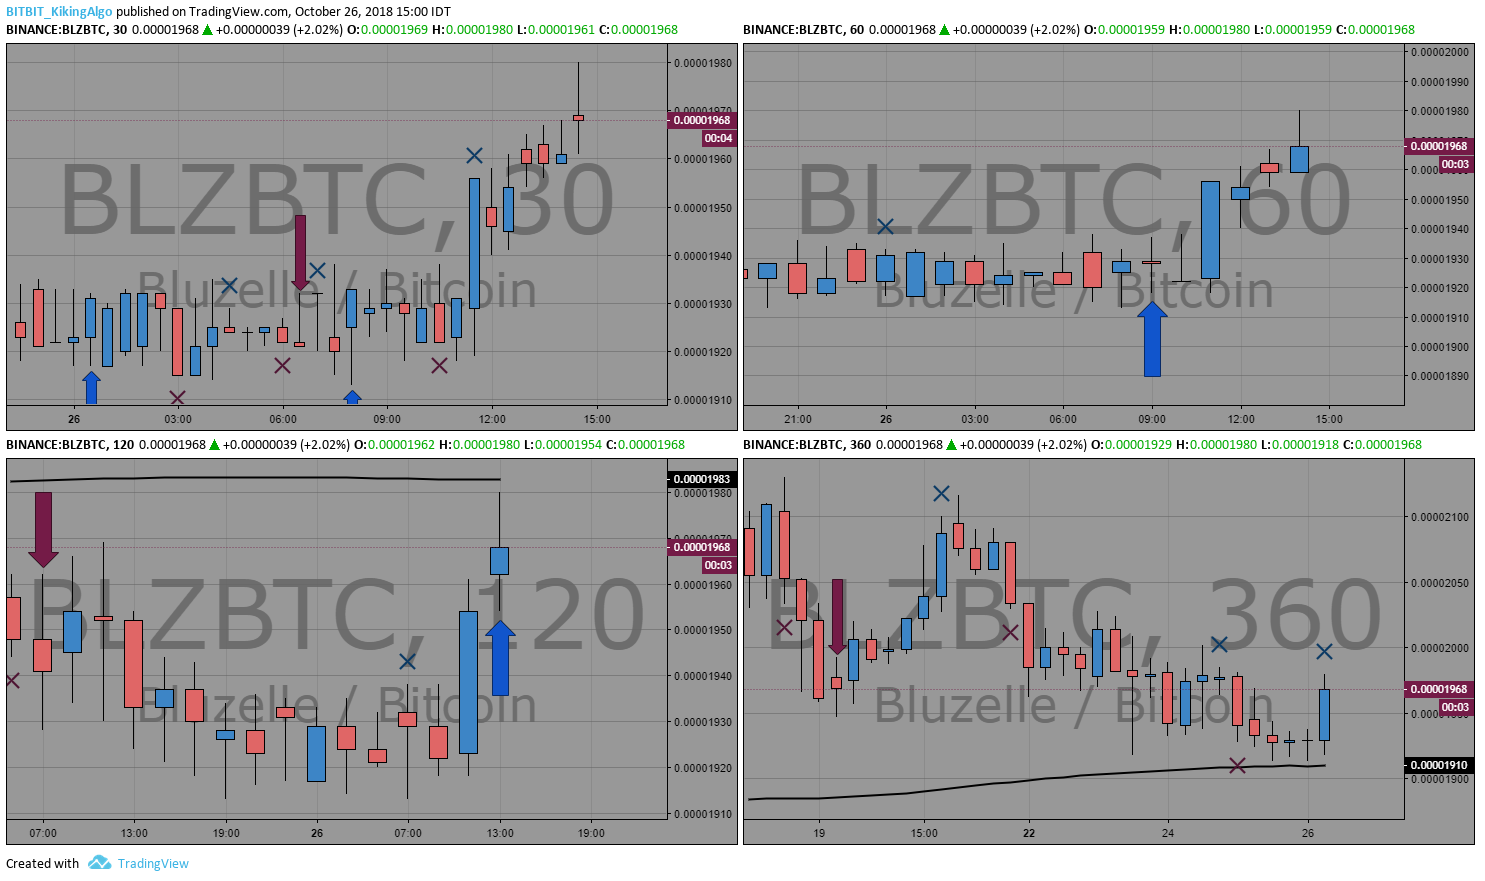
Scenario E | Possible Pump
In the next example, we see 30min print green x with a long call.
That can trigger Pump.
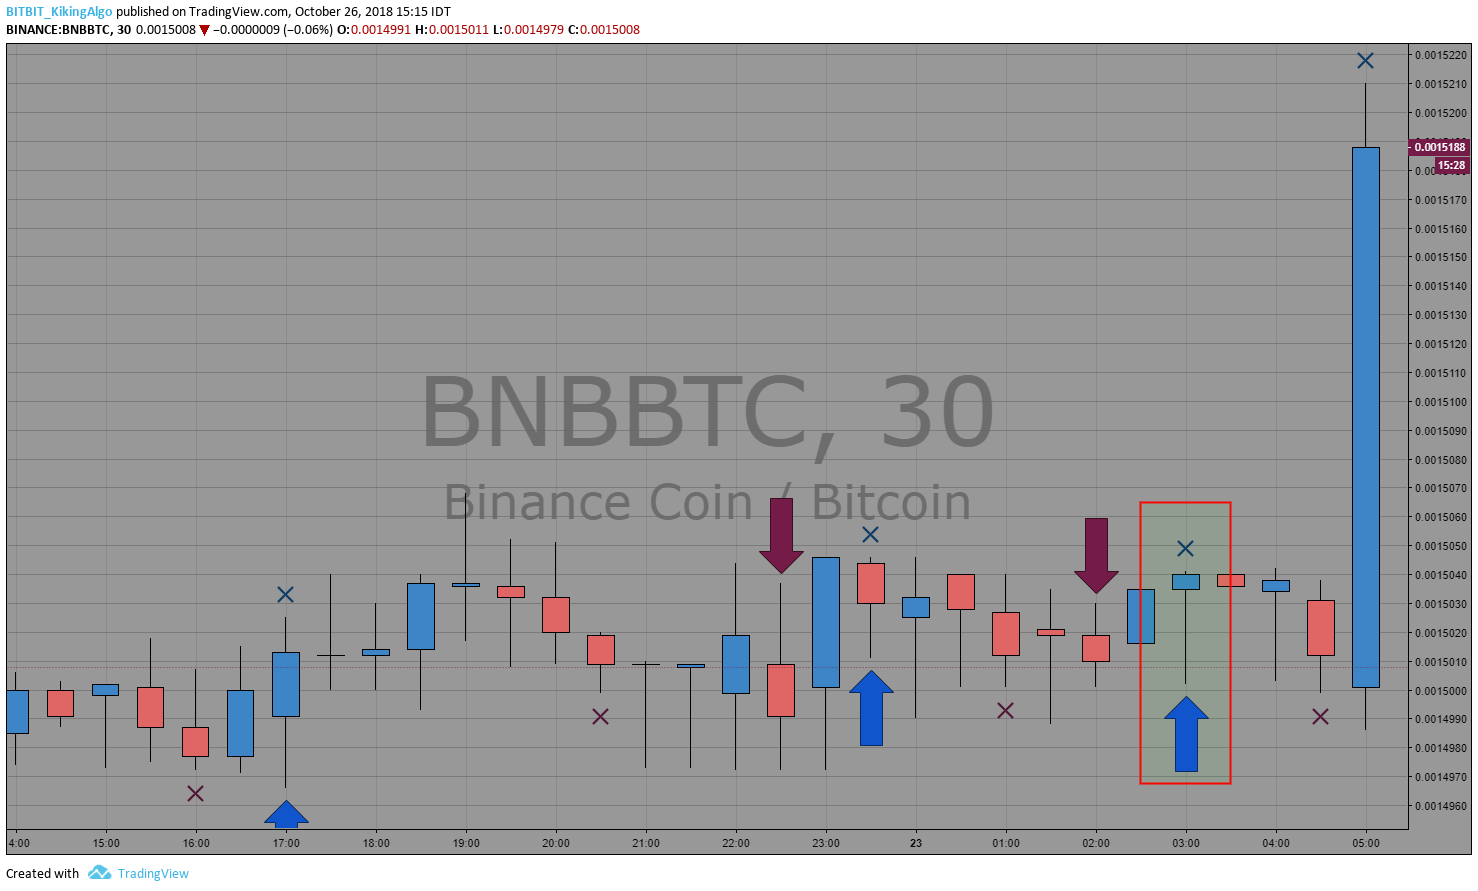
Scenario F | Possible Dump
In the next example, we see 30min print red x with a short call.
That can trigger Dump.
